In the U.S. Virgin Islands there is one season, summer! Average air temperatures in a “winter” month like January; and a “summer” month like July; vary only by 5 or 6 degrees Fahrenheit. Air temperature all year round is typically in the low to mid-80s (27 to 29 Celsius). In “winter” months it rarely gets below 75 degrees (24 Celsius). Even when it rains the air temperature remains warm.
In general extensive rainfall is rather infrequent. When it does rain, whether it’s a sprinkle or a downpour, it usually quickly passes through the area. Rainfall is anticipated during the months of August through November. It is during these months that there is a higher possibility of a full day of rain, or several days of rainy weather.
Temperatures and Rainfall
There are variations between temperatures and rainfall on each island. Tables below show climate normals for St. Croix, St. Thomas and St. John by month. (Resource: NOAA)
| St. Croix (Airport) NCDC 1971-2000 | St. Thomas (Airport) NCDC 1981-2010 | St. John (Cruz Bay) NCDC 1981-2010 | |||||||
| Average | High | Low | Rain | High | Low | Rain | High | Low | Rain |
| Jan | 83.2° | 69.2° | 2.11″ | 85.1° | 72.5° | 2.38″ | 82.4° | 70.3° | 3.01″ |
| Feb | 83.5° | 68.5° | 1.89″ | 85.1° | 72.5° | 1.43″ | 82.5° | 70.2° | 1.77″ |
| Mar | 84.2° | 68.5° | 1.9″ | 85.9° | 72.8° | 1.42″ | 82.8° | 70.5° | 1.70″ |
| Apr | 85.5° | 70.5° | 2.21″ | 87.0° | 74.3° | 2.74″ | 83.1° | 72.3° | 3.09″ |
| May | 86.5° | 73.5° | 3.54″ | 87.6° | 76.2° | 3.06″ | 85.1° | 74.1° | 4.07″ |
| Jun | 87.9° | 75° | 2.49″ | 89.3° | 77.7° | 2.53″ | 86.9° | 76.2° | 2.77″ |
| Jul | 88.6° | 75° | 2.86″ | 90° | 78° | 2.85″ | 88.1° | 76.1° | 3.49″ |
| Aug | 88.5° | 74.9° | 4.03″ | 90.2° | 78.2° | 3.74″ | 87.8° | 76.2° | 3.84″ |
| Sept | 88.3° | 73.7° | 6.22″ | 90° | 77.9° | 5.58″ | 87.6° | 76° | 5.50″ |
| Oct | 87.5° | 73.5° | 6.1″ | 88.8° | 76.8° | 5.42″ | 87.3° | 74.6° | 5.23″ |
| Nov | 85.9° | 71.7° | 6.11″ | 87° | 75.2° | 5.23″ | 86° | 73° | 5.93″ |
| Dec | 84.1° | 70.1° | 3.68″ | 85.6° | 73.5° | 2.96″ | 83.9° | 71.3° | 3.50″ |
| Annual | 86.1° | 72° | 43.14″ | 87.6° | 75.5° | 39.94″ | 85.3° | 73.4° | 43.90″ |
|---|---|---|---|---|---|---|---|---|---|
Fahrenheit (°F) Rain (in.) | |||||||||
It should be noted that differences in temperature and rainfall exist within each island. For example on St. Thomas’ East End, which is somewhat hotter and drier than other parts of St. Thomas, the average annual rain fall between 1981-2010 was 39.90 inches. We can compare this to an area on the cooler and wetter Nothside of the island where the average rainfall for the same period of time was 43.70 inches. It is not unusual for a friend on one part of the island to call another and ask “is it raining by your place, it is by me” and for the response to be “nope it’s sunny over here”.
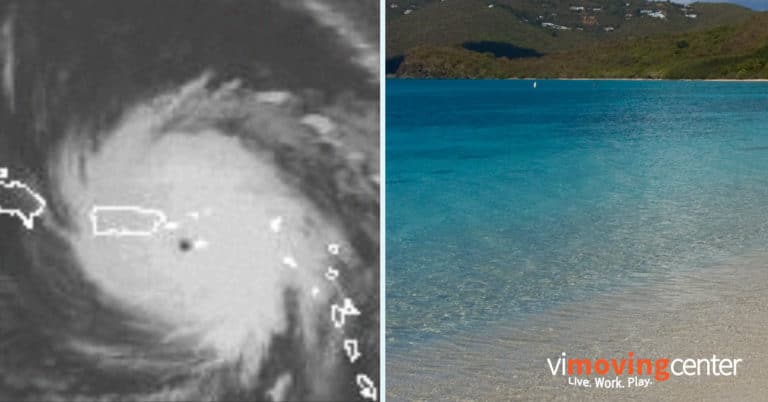
Hurricanes
One of the greatest natural threats in the Virgin Islands is hurricanes. A hurricane is a wind system that forms in a spiral shape. It circulates around a central point, called the eye. The storms are classified according to formation stage; Tropical Depression, Tropical Storm and Hurricane. Atlantic Hurricane Season runs from June 1st to November 30th with the highest occurrences of storms in August and September. The table below indicates tropical storm and hurricane activity which occurred within two degrees of the Virgin Islands and Puerto Rico from 1901 to 2012. (Resource: NOAA)
Storm Activity from 1901-2012
| Jan | Feb | Mar | Apr | May | Jun | Jul | Aug | Sept | Oct | Nov | Dec | |
| Storms | 1 | 0 | 0 | 0 | 0 | 0 | 7 | 28 | 33 | 8 | 4 | 1 |
During tropical storms and hurricanes residents of the Virgin Islands secure personal belongings and homes and wait out the winds and rains. Hurricane warnings and watches are given by government and news agencies as the storms approach is monitored. The most recent hurricanes affecting the islands were Hurricanes Irma and Maria in September 2017; Hurricane Marilyn in 1995; and Hurricane Hugo in 1989. There have been smaller hurricanes and storms that have impacted the USVI during this time as well.